Trade fair analytics in practice: real results from real stands.
Two evaluations to read.
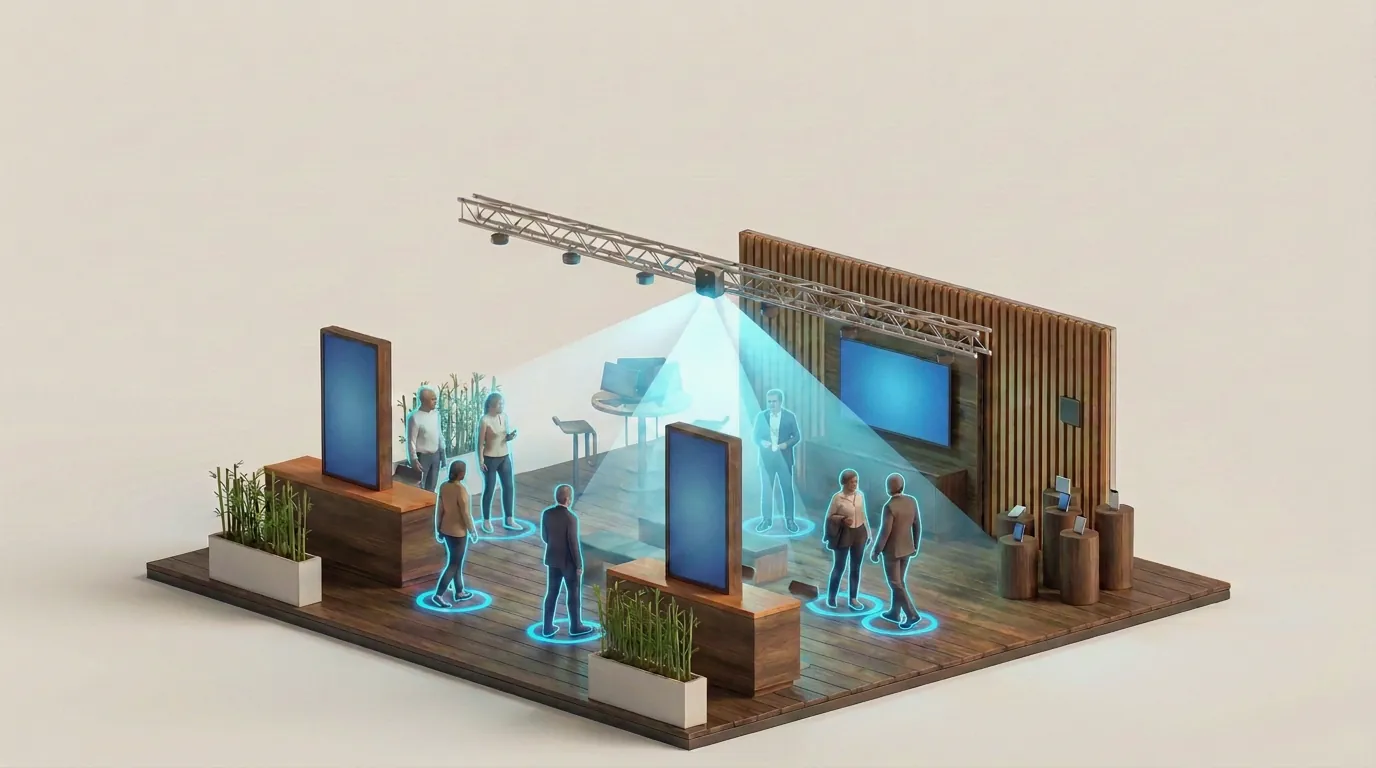 Trussmounted at approx. 6 m
Sensorapprox. 3 × 3 cm
Powerone socket is enough
Visitorscaptured anonymously
Trussmounted at approx. 6 m
Sensorapprox. 3 × 3 cm
Powerone socket is enough
Visitorscaptured anonymously
over90 %
of our customers book VISPAL again for their next trade fair.

VISPAL can be booked in the Messe Frankfurt exhibitor shop.








Numbers alone don’t get you anywhere. VISPAL is trade fair analytics with sensors: alongside the visitor numbers, it delivers concrete recommendations for action. Backed by the figures and 25 years of trade fair experience.
Camera sensors capture visitor numbers, behaviour patterns and interactions.
Standard: visitor numbers, dwell time, walking routes
And beyond that:
Data turns into patterns and correlations between visitors, stand and staff.
You get recommendations for space, exhibits and staffing.
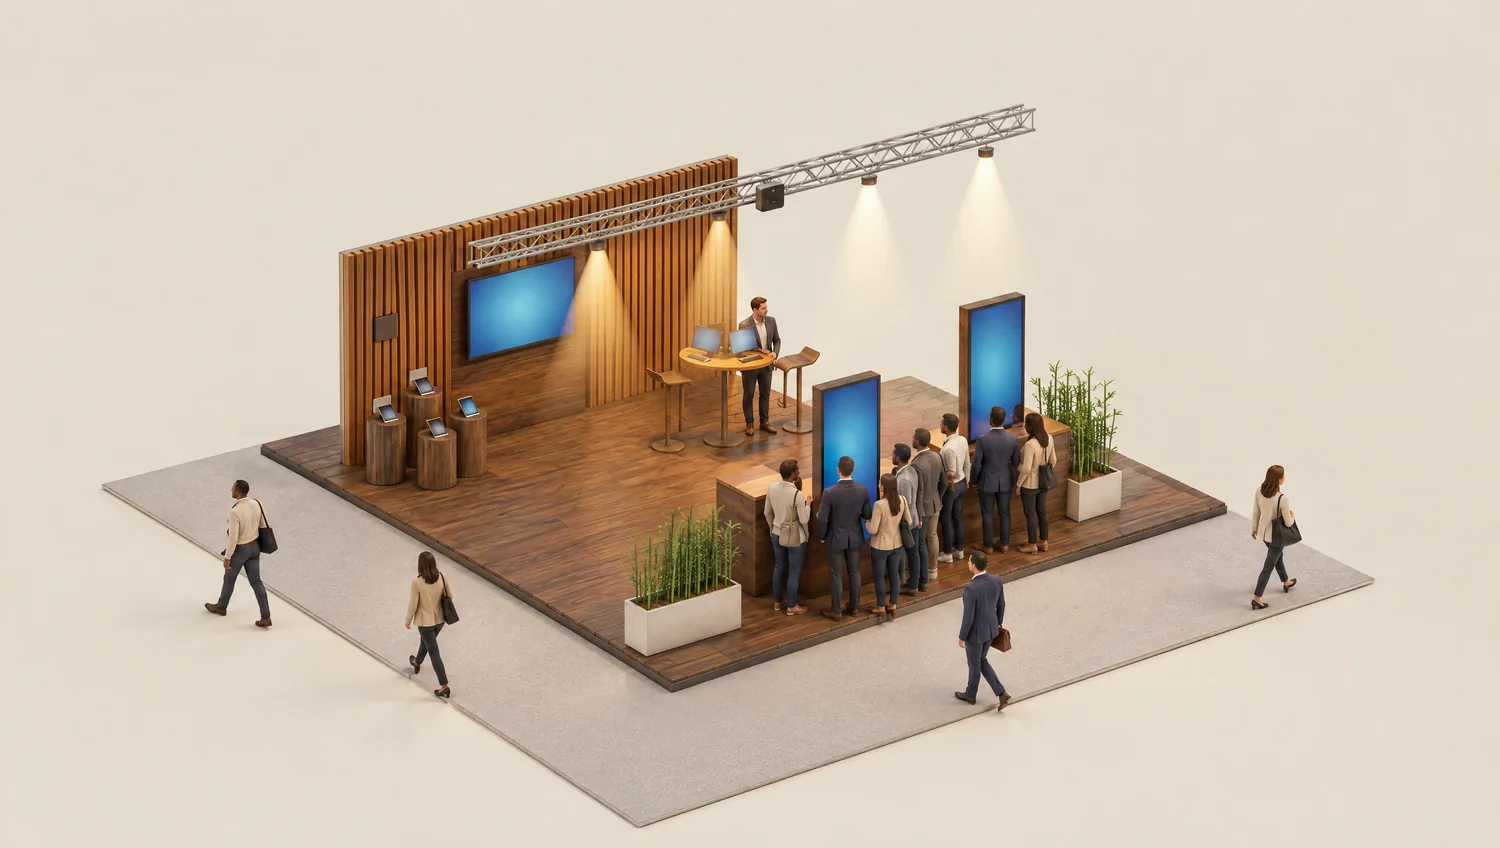 Crowded at the frontat the screensEmpty at the backhigh table and exhibitsMany walk past
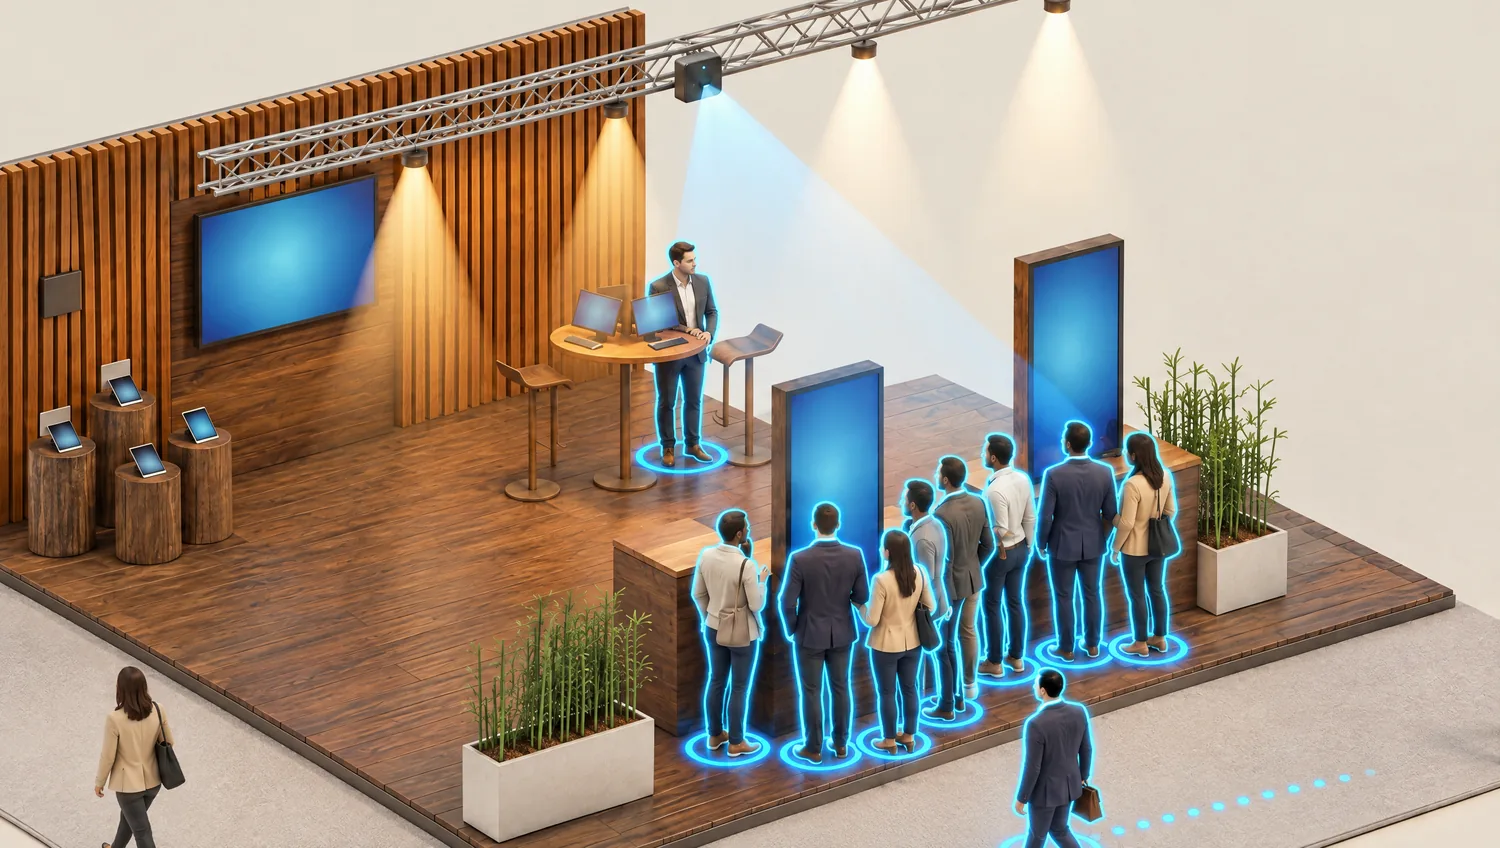 Sensoron the trussstopsdwell timewalks pastroute capturedStaff waiting aloneno conversationExhibits without visitorsat the back wall
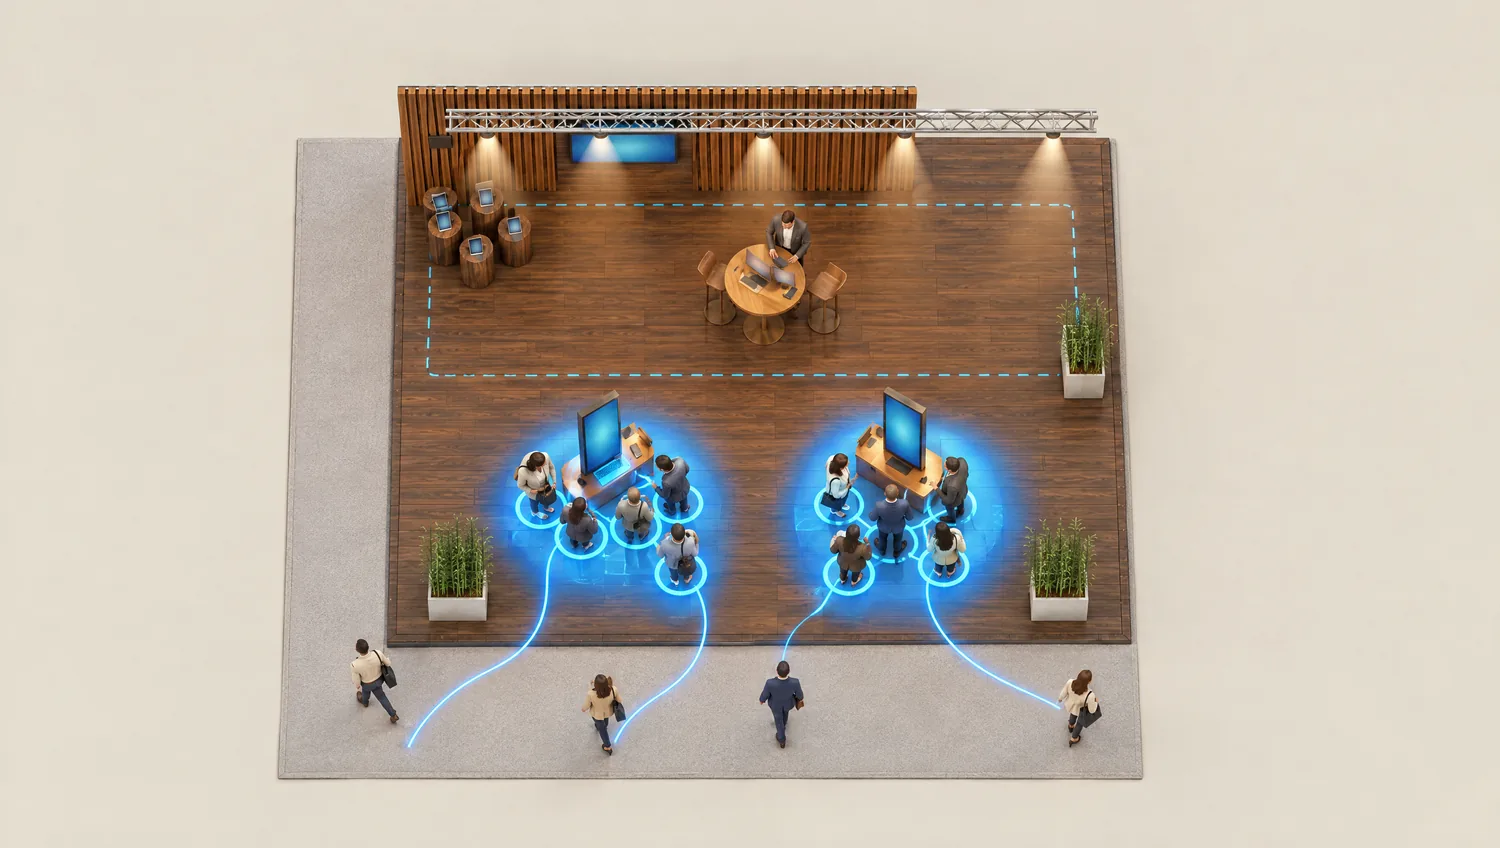 Dead spacenobody enters itHotspotsvisitors stay hereWalking routesfrom the aisle to the stand
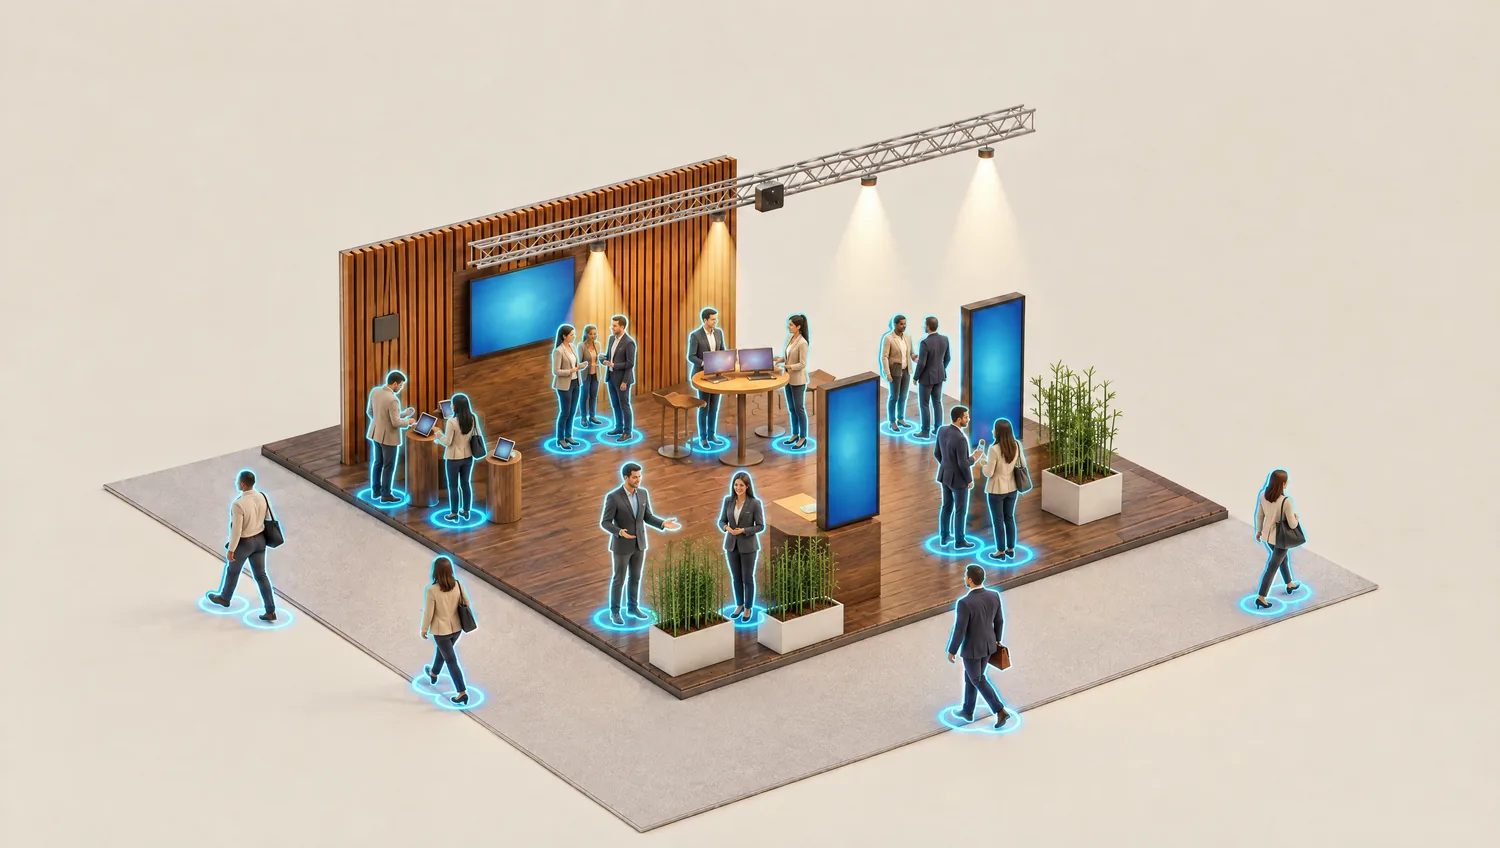 Exhibits to the aisle edgeExhibit placementThe whole area is workingStand layoutStaff at the aisleStaffing
Dead spacecosts rent.
Two evaluations to read.
78 %
of the attention was on a single side of the stand.
HELLA, Select Congress 2026, Stuttgart
View case study (German)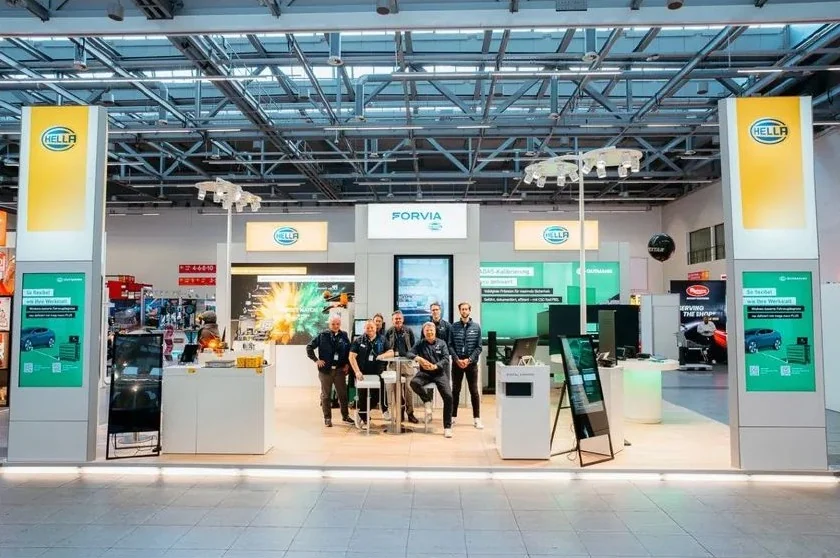
10 % → 25 %
One tenth of the stand area received almost a quarter of the attention.
NEURA Robotics, Automate 2026, Chicago
View case study (German)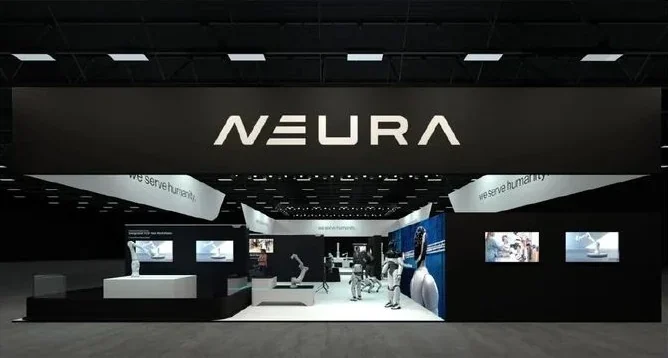
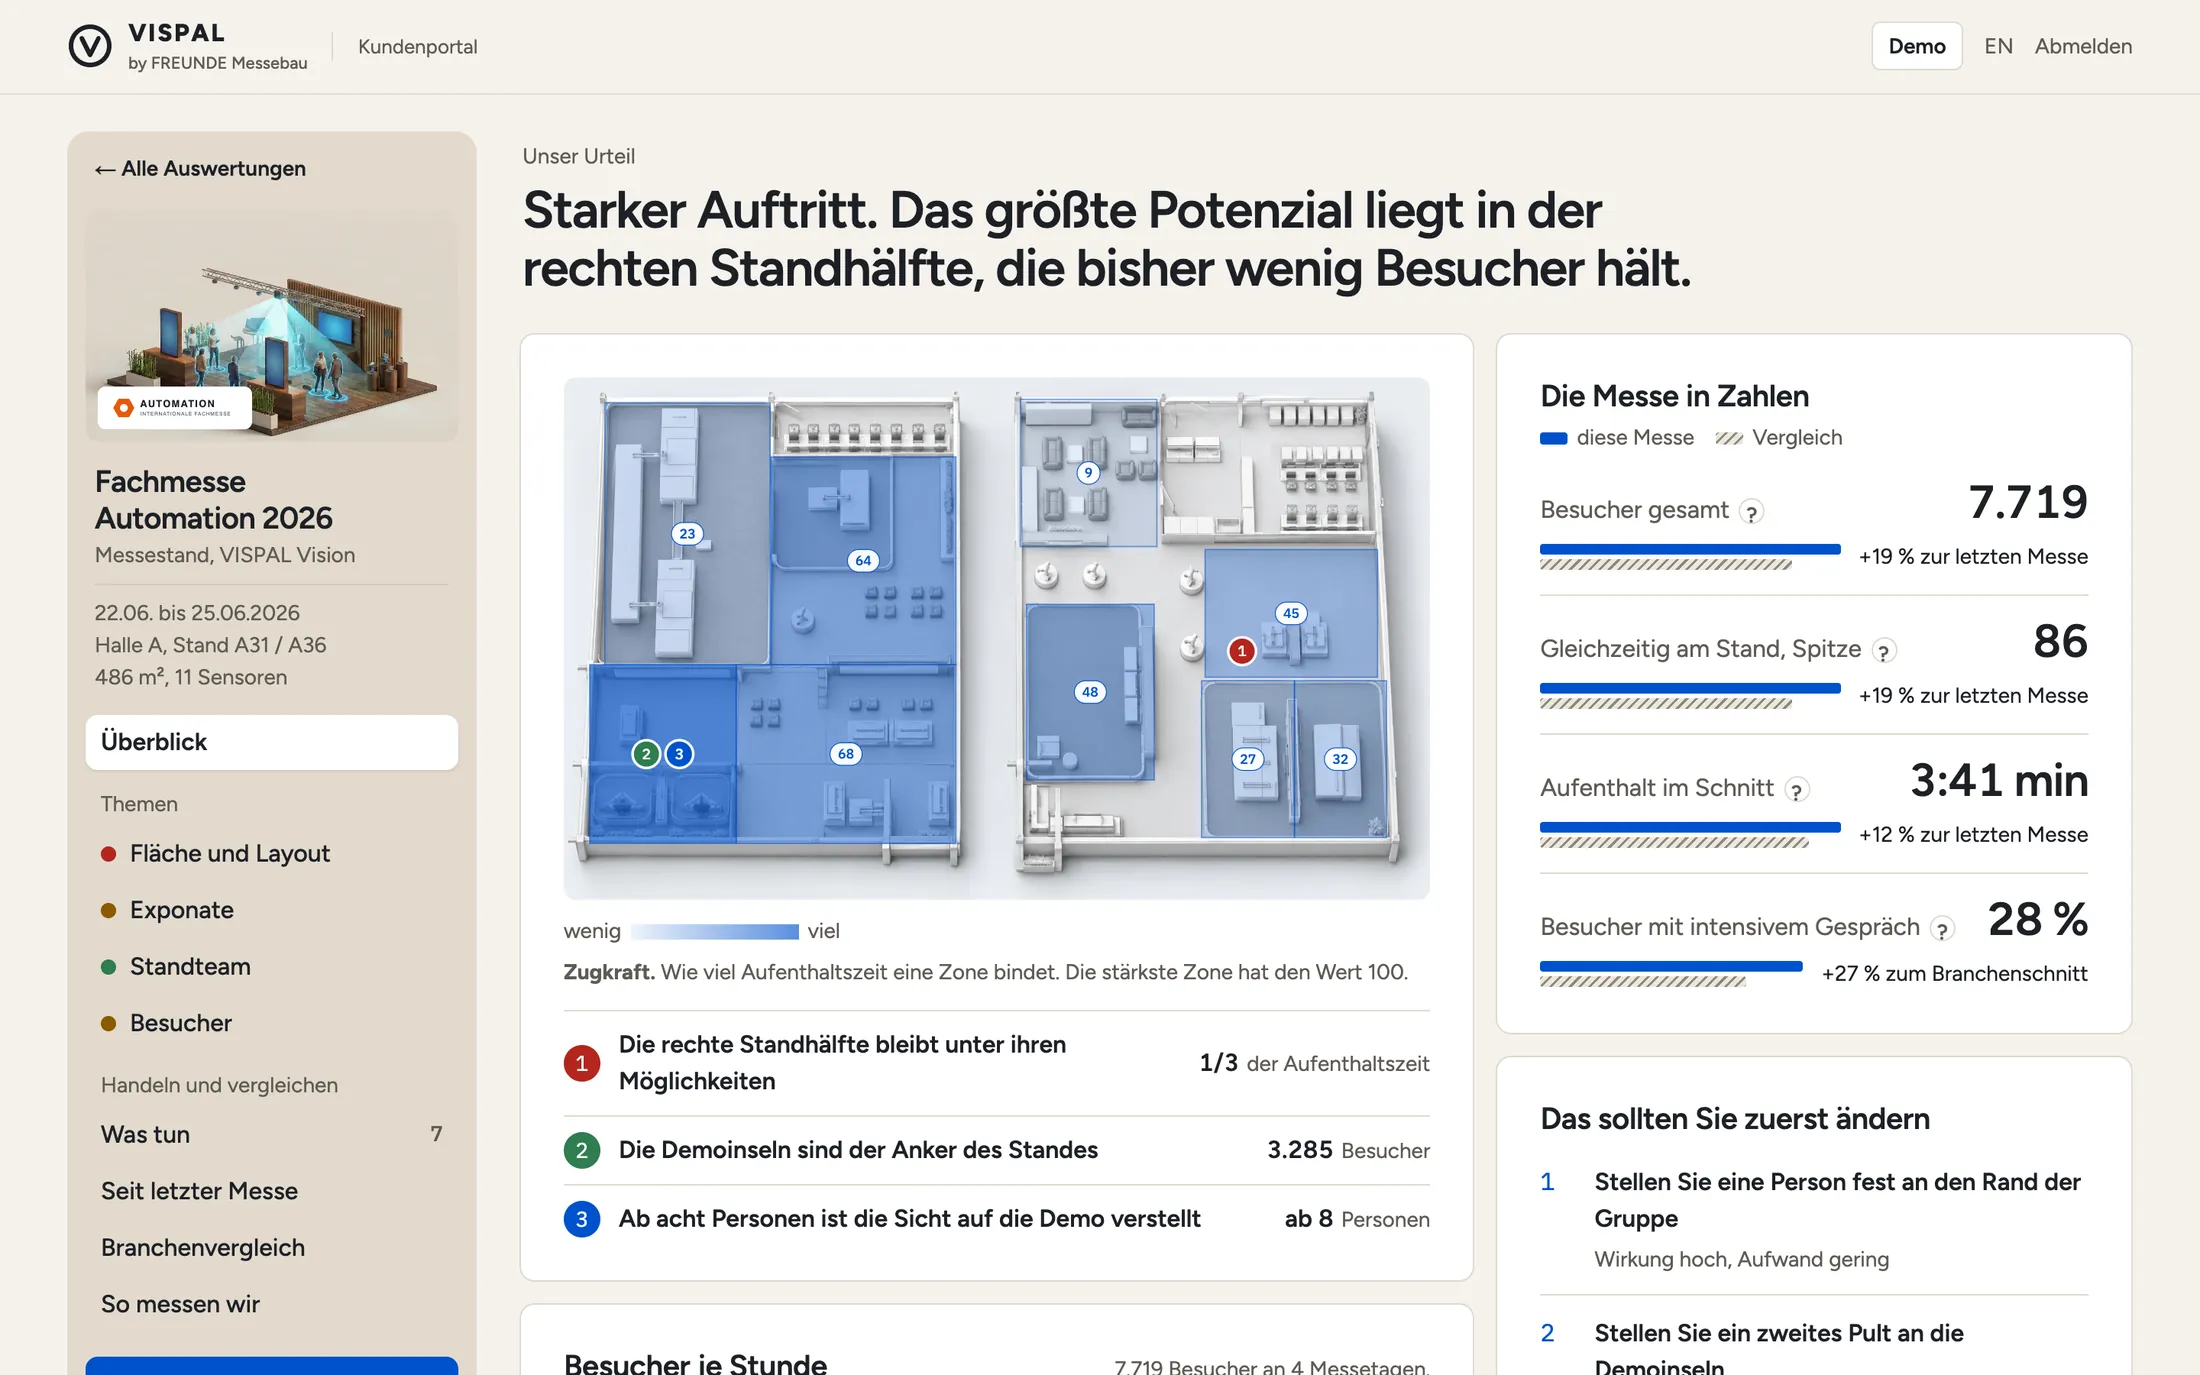
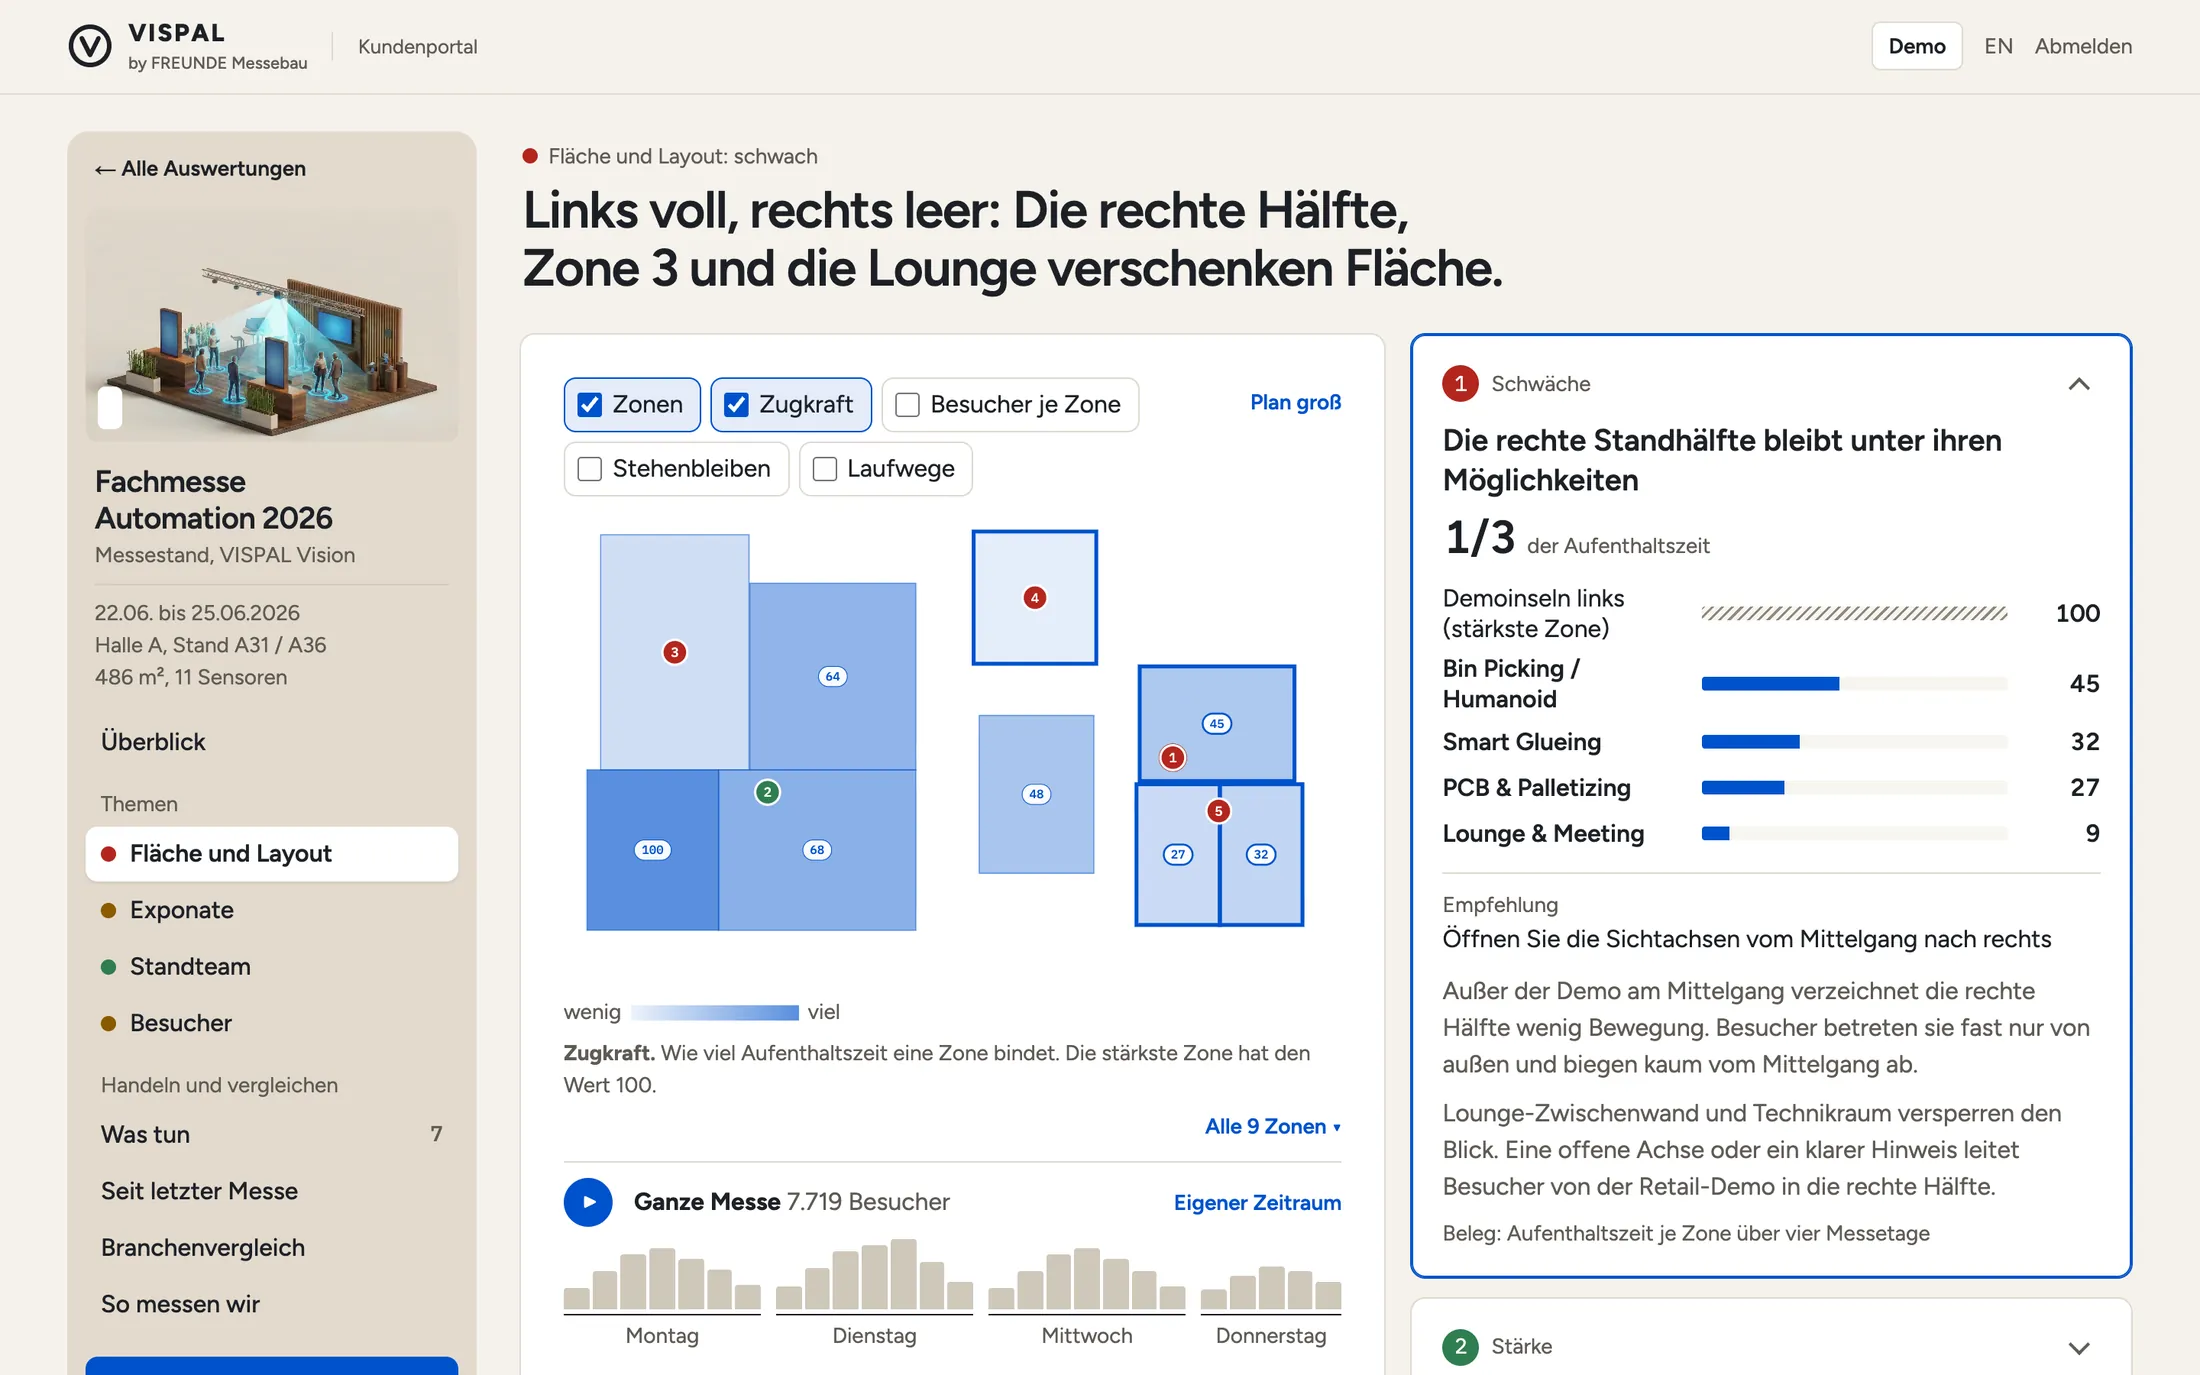
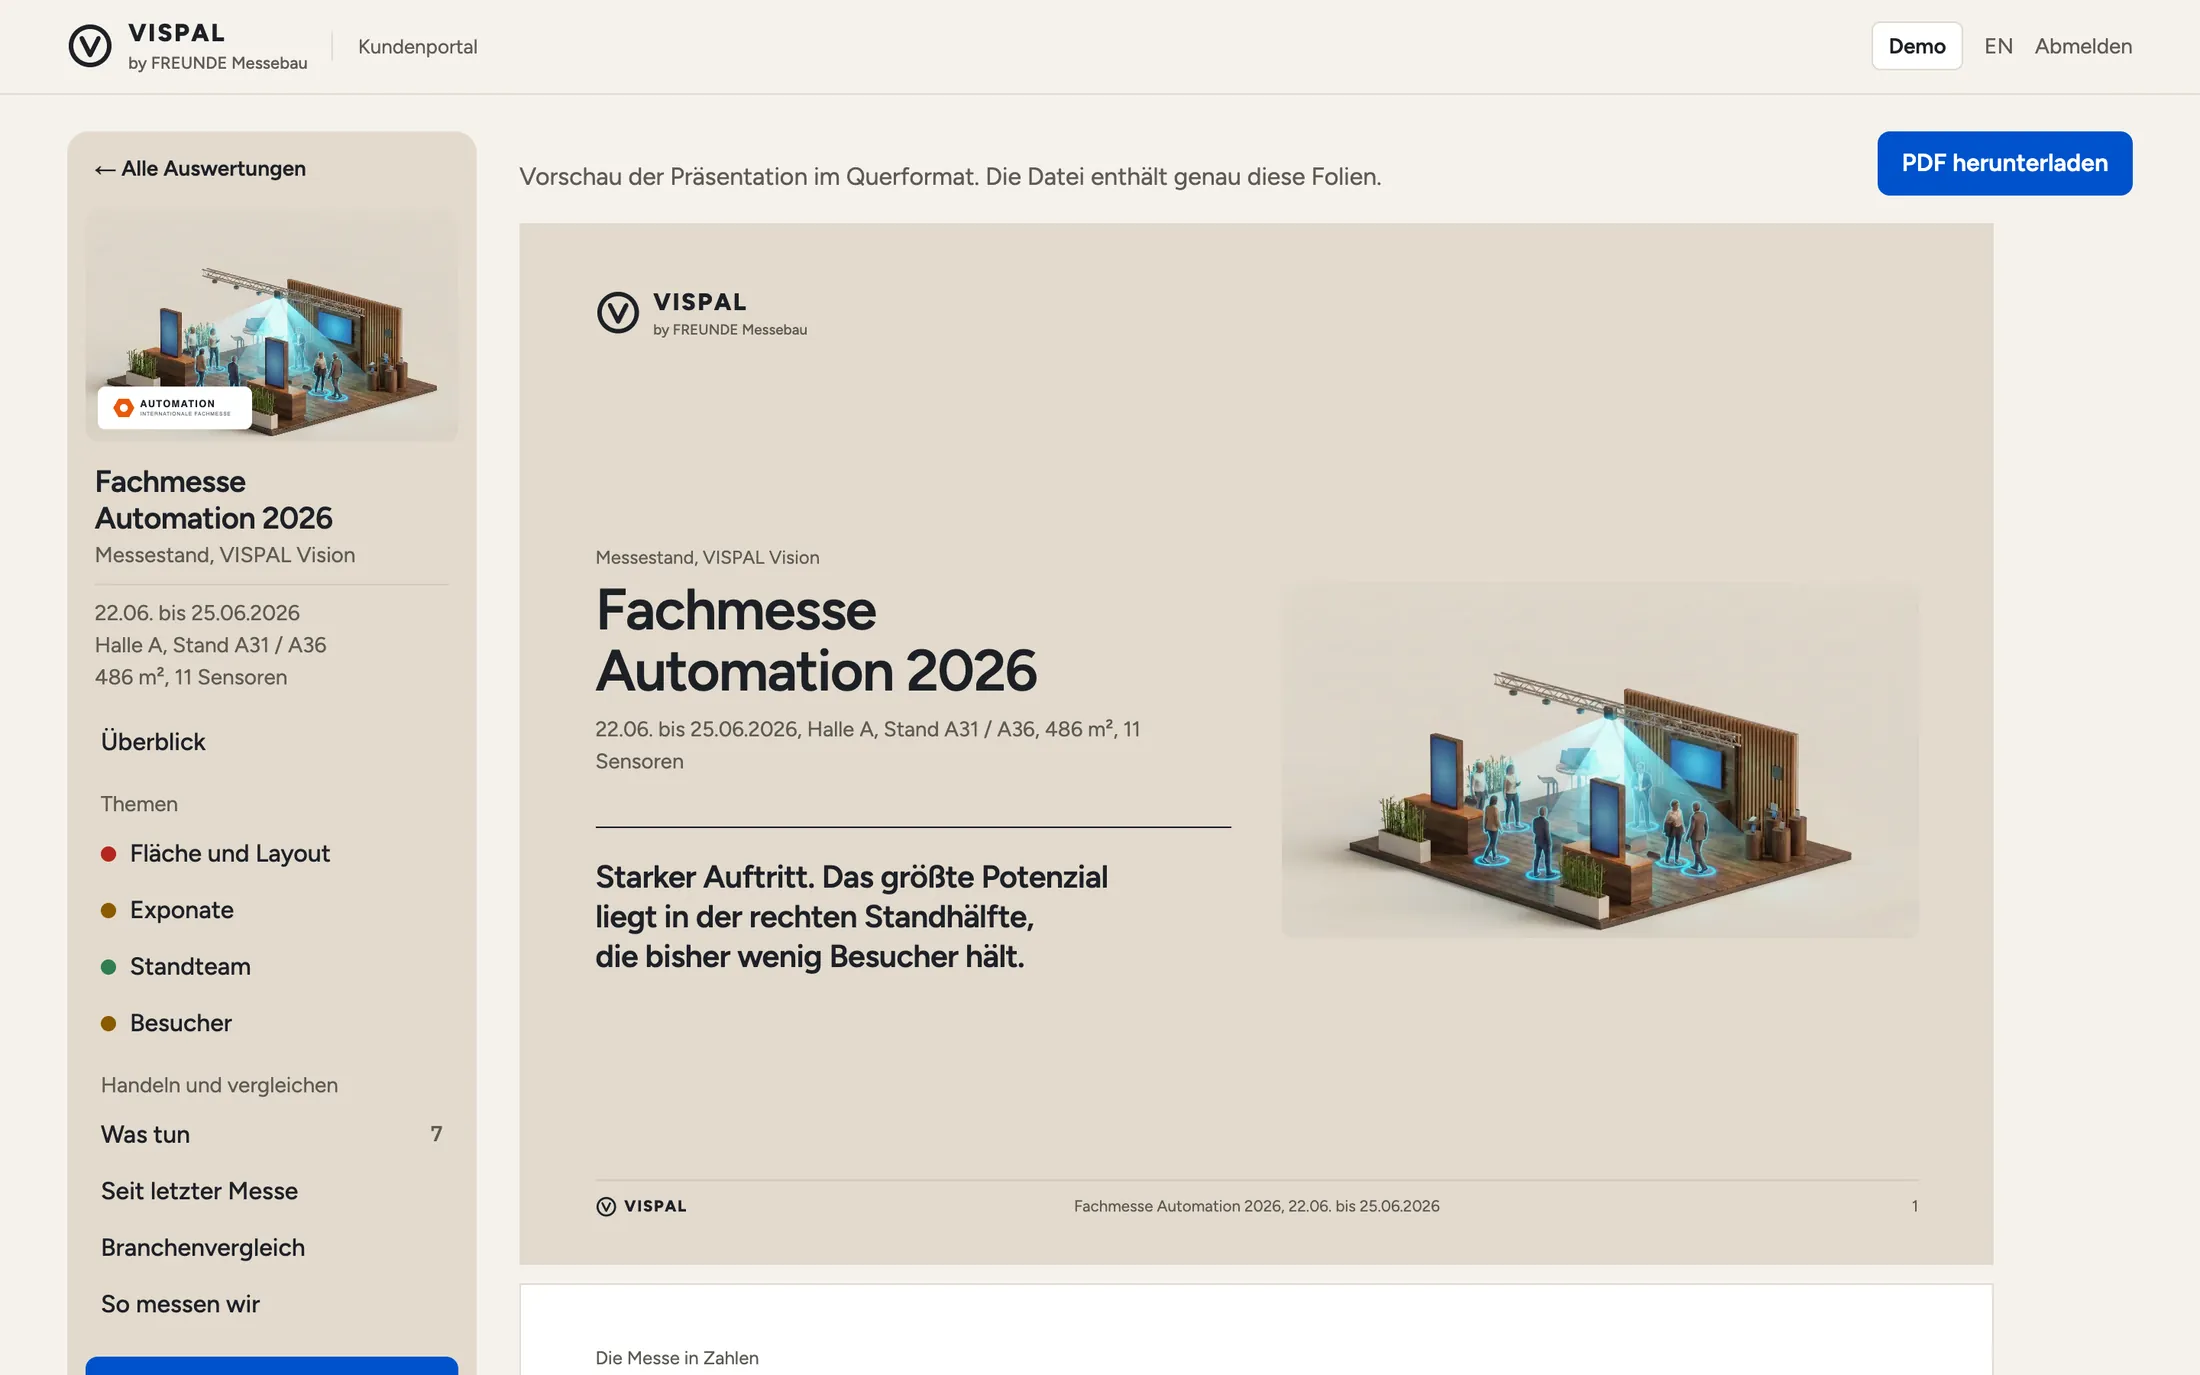
Views from the customer portal with sample values (shown here in German)
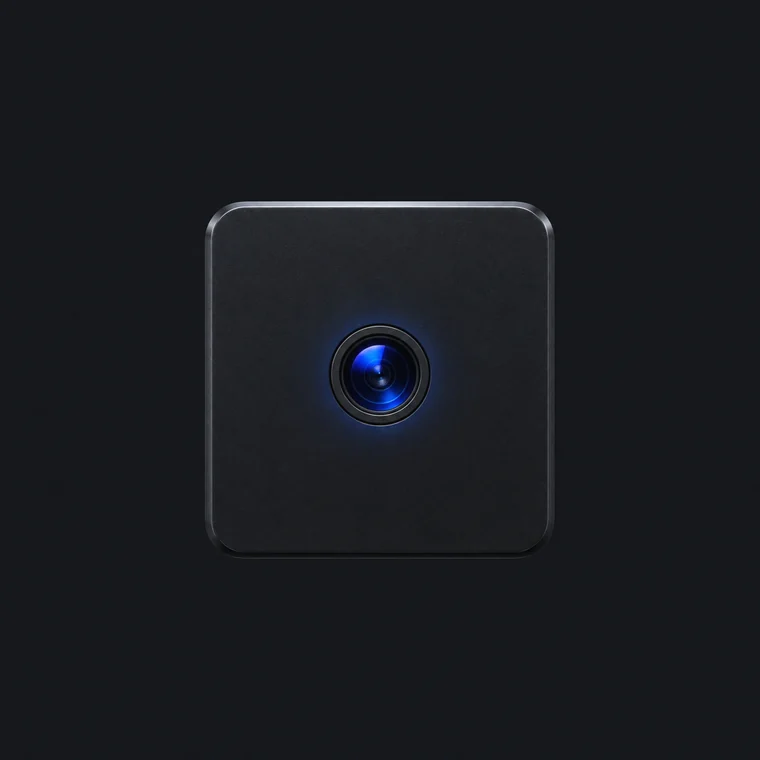
The sensors don’t bother anyone. Most visitors don’t even notice them, because they are far too small.
Booking VISPAL takes you 25 minutes. Then we take over: we gather the information we need ourselves and coordinate directly with your stand builder. You don’t have to worry about anything else.
One call/Send the stand plan/Choose an installation option
Sensors and equipment/Shipping or on-site installation/Installation plan/Evaluation of the show/Online dashboard and PDF/Debrief
| What you learn | 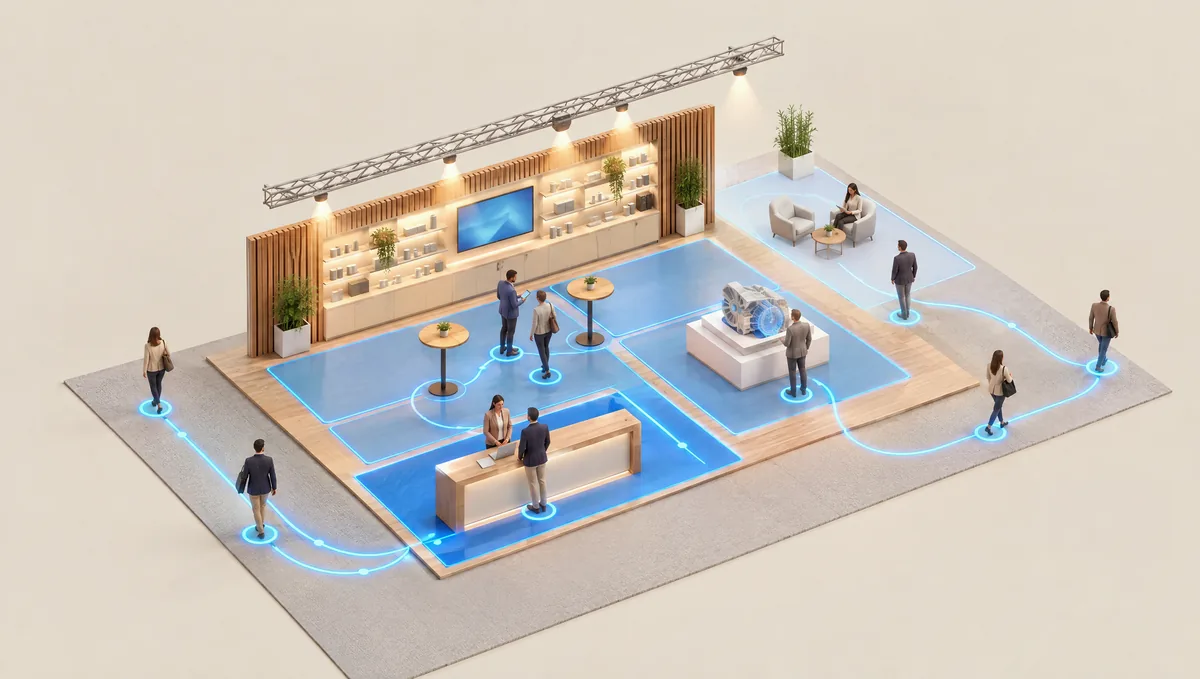 Position analysis Position analysisVISPAL AnalyticsHow many visitors come, which routes they take and how long they stay. |
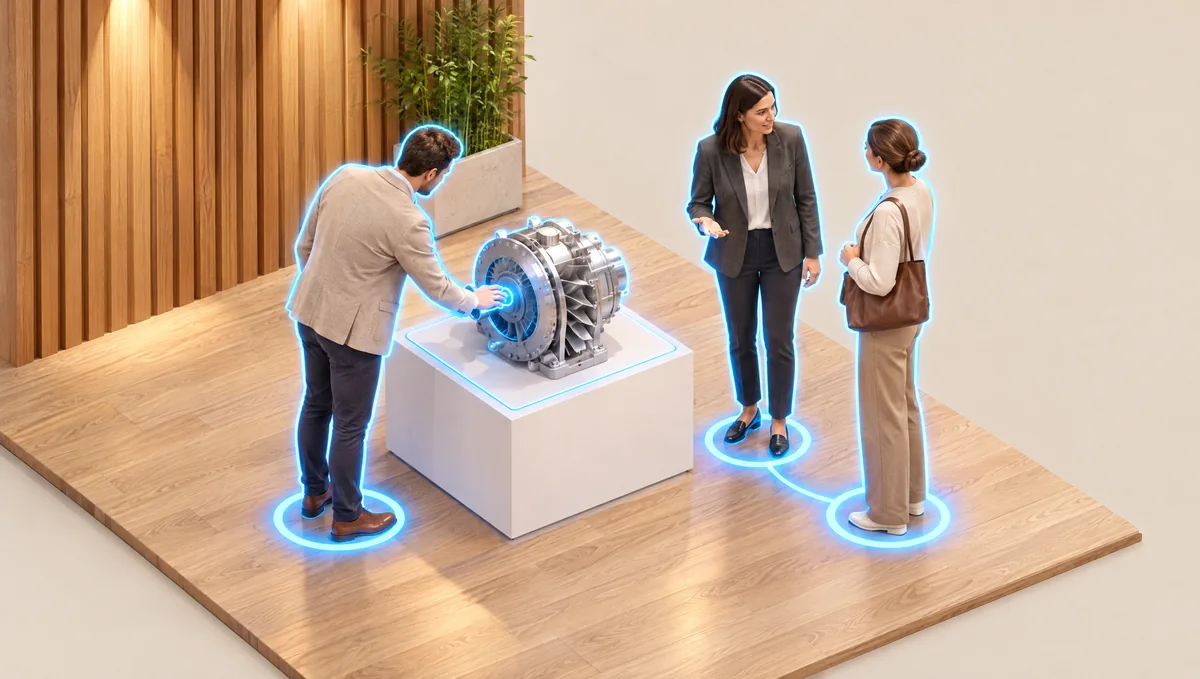 Behaviour analysis Behaviour analysisVISPAL VisionWhat visitors actually do on the stand, not just where they stand. |
|---|---|---|
| Visitor numbers | ||
| Walking routes | ||
| Dwell time | ||
| Heat map and comparison of stand zones | ||
| Behaviour patterns | ||
| Interactions with exhibits and staff | ||
| Correlations between visitors, stand and staff | ||
| Request a quote | Request a quote |
Shipping both ways, illustrated installation guide, remote support during the show, online dashboard with PDF download.
Then try VISPAL without much effort or investment.
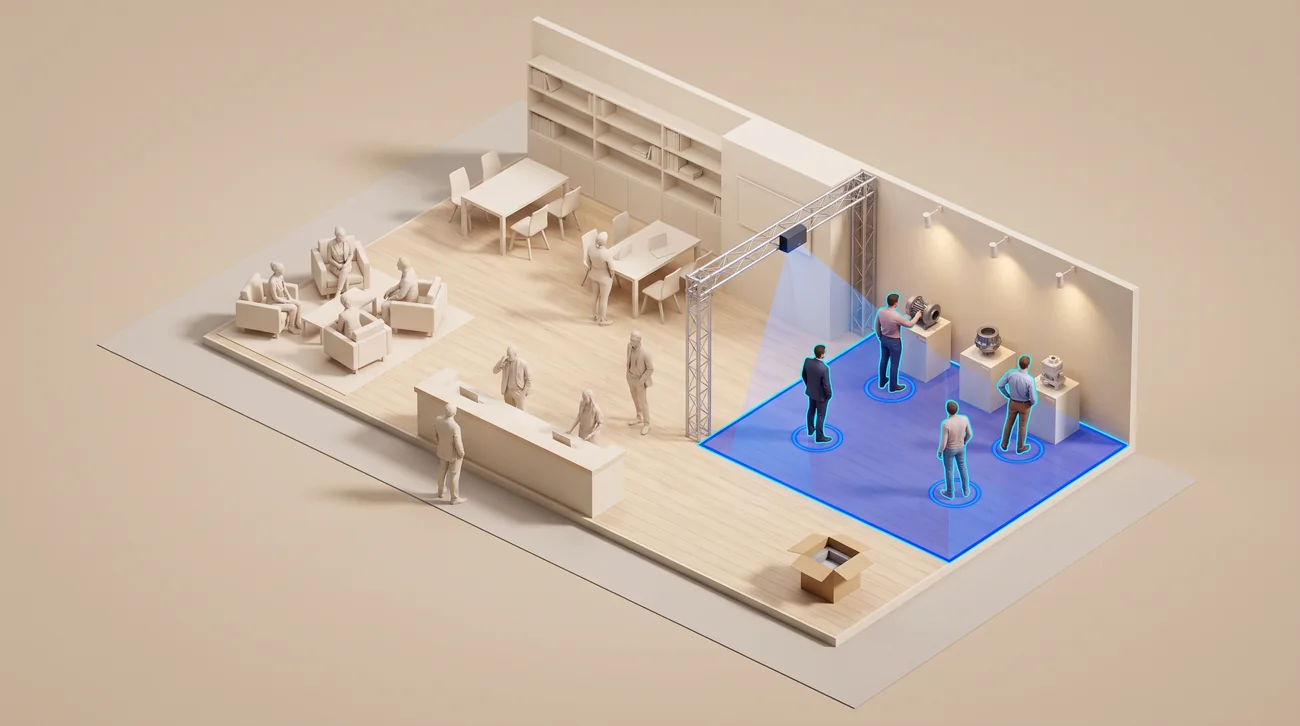
We evaluate one area of your stand, for example the exhibit area or a presentation space. In the full quality of VISPAL Vision, for one zone.
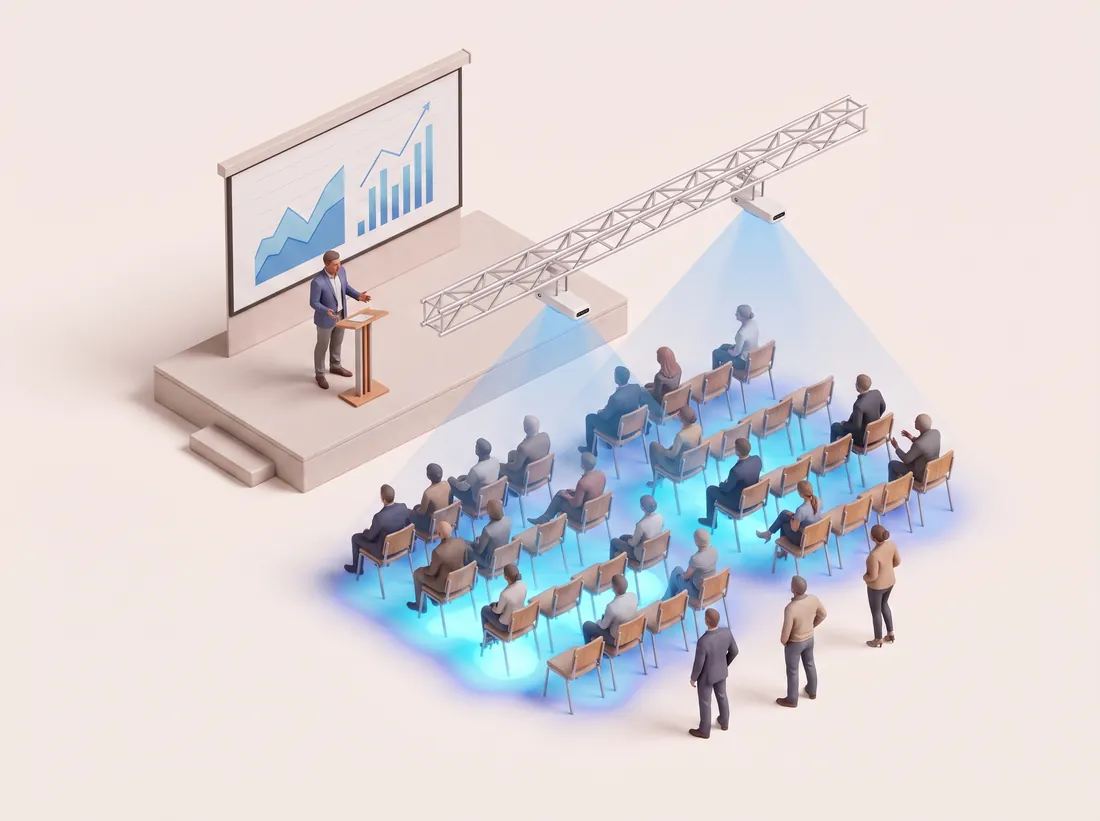 Events and talksHow many listen and how long they stay.
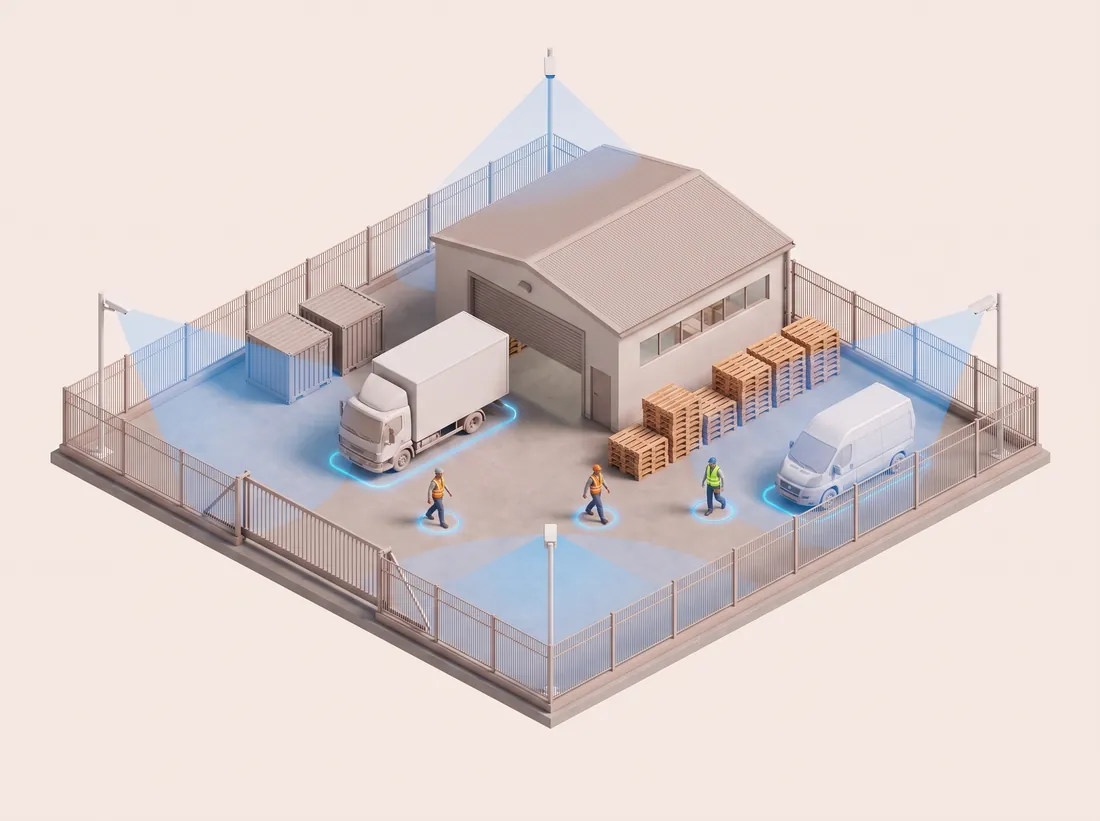 Sites and logisticsMovements in the yard and on the access road.
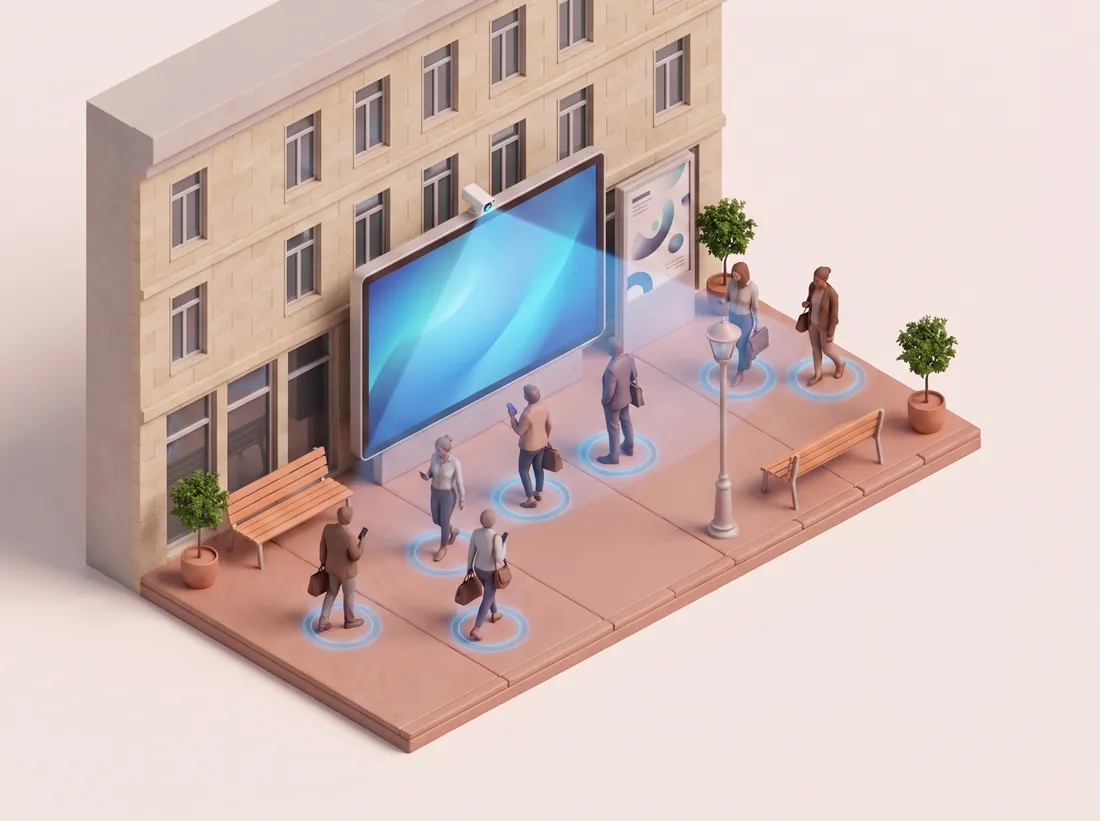 Outdoor advertisingWho stops in front of the screen.
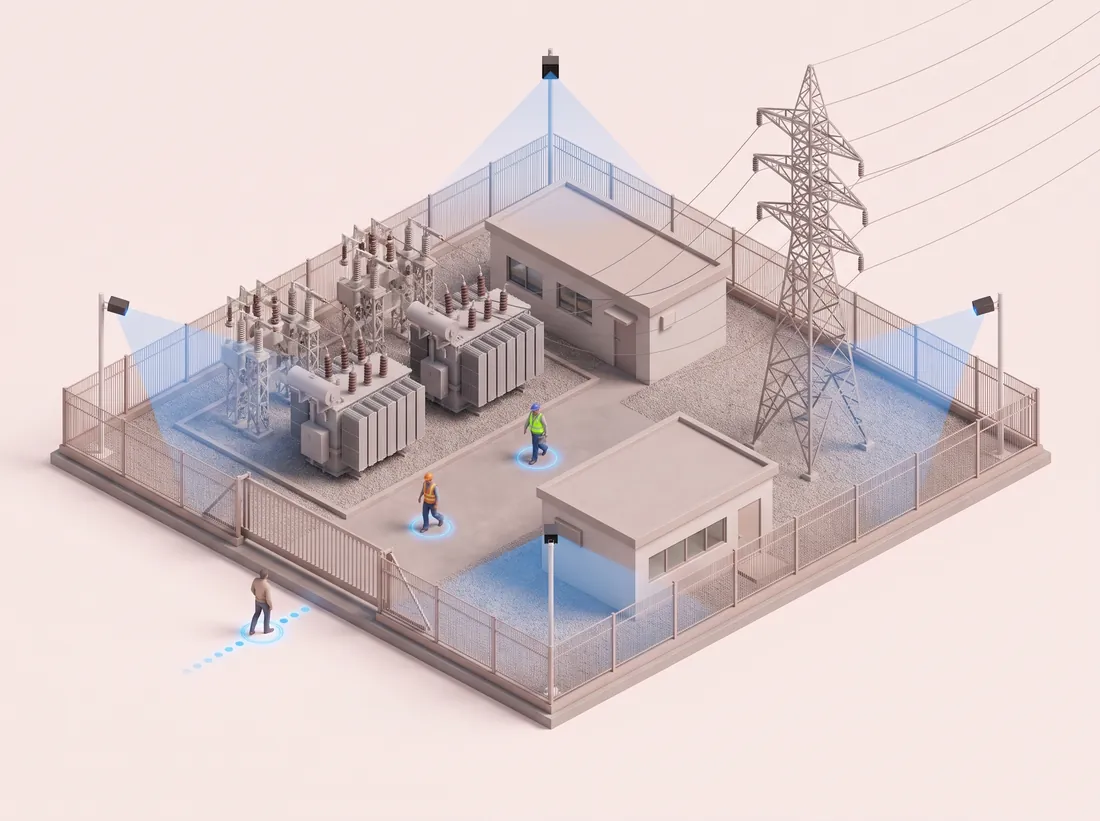 Securing critical infrastructureWho approaches the fence and gate.
| Sensor | approx. 3 × 3 cm, barely visible on the truss |
|---|---|
| Mounting | typically on the truss, but also possible on any wall or other surface |
| Installation | approx. 30 minutes for a 400 m² stand |
| Power | one standard (Schuko) socket, approx. 500 W |
| Internet | Stand Wi-Fi or network cable. Included in Frankfurt, possible without your own stand Wi-Fi |
| Lead time | usually two weeks |
| Report | within 5 working days after the trade fair. Express within 2 days possible. Live dashboard and live evaluation also possible |
| Languages | German and English |
Your question isn’t listed? Write to us or book a meeting.
Trade fair analytics shows what actually happens on your stand: how many visitors come, which routes they take, where they stop and where they talk to your team. VISPAL measures this with camera sensors and derives recommendations for space, exhibits and staffing.
Small camera sensors, about 3 × 3 cm in size, hang from the truss, on a wall or on another surface. They capture visitor numbers, walking routes, dwell time, behaviour patterns and interactions. You receive the evaluation in the online dashboard and as a PDF presentation.
Visitor counting tells you how many people were there. Trade fair analytics with VISPAL Vision also shows what visitors do: who just looks, who stops, who touches an exhibit and who starts a conversation.
Yes. VISPAL captures visitors anonymously: no faces, no names.
To try it out, there is VISPAL One at a fixed price of €799: one sensor, one zone of up to 10 × 10 m. For VISPAL Analytics and VISPAL Vision you receive a quote.
Booking takes you 25 minutes. After that we gather the information we need ourselves and coordinate directly with your stand builder.
You receive the report within 5 working days after the trade fair. On request there is an express evaluation, or a live evaluation during the show itself.
Write to us or book a meeting right away.
We usually get back to you the same working day.
The calendar is loading.
Calendar not showing? Open the booking page in a new window